
- รับลิงก์
- X
- อีเมล
- แอปอื่นๆ
THE GREAT PACIFIC GARBAGE
credit : https://youtu.be/0EyaTqezSzs
WHAT IS THE GREAT PACIFIC
GARBAGE PATCH?
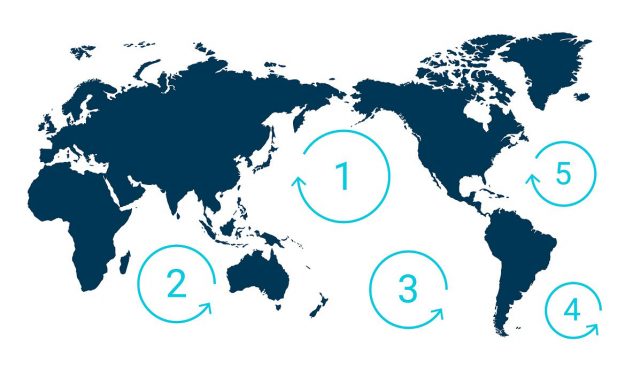
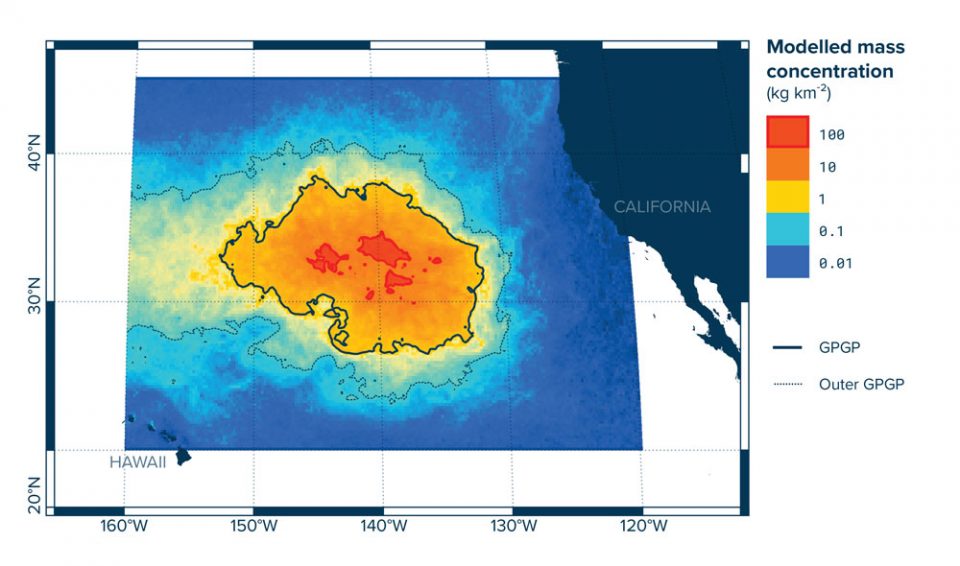
The Great Pacific Garbage Patch (GPGP) is the largest of the five offshore plastic accumulation zones in the world’s oceans. It is located halfway between Hawaii and California.
PLASTIC ACCUMULATION
It is estimated that 1.15 to 2.41 million tonnes of plastic are entering the ocean each year from rivers. More than half of this plastic is less dense than the water, meaning that it will not sink once it encounters the sea.
1.15 TO 2.41 MILLION METRIC TONNES OF PLASTIC ARE ENTERING THE OCEAN EACH YEAR.
The stronger, more buoyant plastics show resiliency in the marine environment, allowing them to be transported over extended distances. They persist at the sea surface as they make their way offshore, transported by converging currents and finally accumulating in the patch.
Once these plastics enter the gyre, they are unlikely to leave the area until they degrade into smaller microplastics under the effects of sun, waves and marine life. As more and more plastics are discarded into the environment, microplastic concentration in the Great Pacific Garbage Patch
( The term was coined by Charles J. Moore, returning home through the North Pacific Gyre after competing in the Transpac sailing race in 1997. )
ESTIMATION OF SIZE
The GPGP covers an estimated surface area of 1.6 million square kilometers, an area twice the size of Texas or three times the size of France.
THE GREAT PACIFIC GARBAGE PATCH COVERS AN ESTIMATED SURFACE OF 1.6 MILLION SQUARE KILOMETERS
To formulate this number, the team of scientists behind this research conducted the most elaborate sampling method ever coordinated.
This consisted of a fleet of 30 boats, 652 surface nets and two flights over the patch to gather aerial imagery of the debris.
Sampling at different locations within the same time period allowed a more accurate estimate of the size of the patch and the plastic drifting in it.
" 1.15 TO 2.41 MILLION
METRIC TONNES OF
PLASTIC ARE ENTERING
THE OCEAN EACH YEAR. "
LOCATION
Due to seasonal and interannual variabilities of winds and currents, the GPGP’s location and shape are constantly changing. Only floating objects that are predominantly influenced by currents and less by winds were likely to remain within the patch.
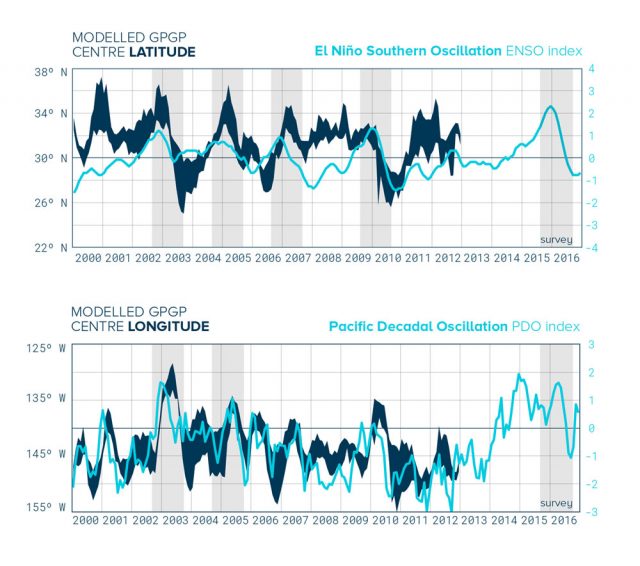
By simulating concentration levels in the North Pacific, the researchers were able to follow the location of the patch, demonstrating significant seasonal and interannual variations. On average the patch orbits around 32°N and 145°W. However, the team observed seasonal shift from west to east and substantial variations in latitude (North to South) depending on the year.
HOW MUCH PLASTIC FLOATS IN
THE GREAT PACIFIC GARBAGE
PATCH?
At the time of sampling, there were more than 1.8 trillion pieces of plastic in the patch that weigh an estimated 80,000 tonnes. These figures are much higher than previous calculations.
TOTAL MASS AND COUNT
" 80’000 TONNES OF
PLASTIC FLOAT IN
THE GPGP,
EQUIVALENT TO
500 JUMBO JETS "
The center of the GPGP has the highest density and the further boundaries are the least dense. When quantifying the mass of the GPGP, the team chose to account only for the denser center area. If the less-dense outer region was also considered in the total estimate, the total mass would then be closer to 100,000 tonnes.
A total of 1.8 trillion plastic pieces were estimated to be floating in the patch – a plastic count that is equivalent to 250 pieces of debris for every human in the world.
Using a similar approach as they did when figuring the mass, the team chose to employ conservative estimations of the plastic count. While 1.8 trillion is a mid-range value for the total count, their calculations estimated that it may be range from 1.1 to up to 3.6 trillion pieces.
CONCENTRATION
Using data from multiple reconnaissance missions, a mass concentration model was produced to visualize the plastic distribution in the patch.
The mass concentration model, pictured below, shows how the concentration levels gradually decrease by orders of magnitude towards the outside boundaries of the GPGP. The center concentration levels contain the highest density, reaching 100s of kg/km² while decreasing down to 10 kg/km² in the outermost region.
These results prove that plastic pollution at sea, while densely distributed within the patch, is scattered and does not form a solid mass, thus demystifying the trash island concept.
VERTICAL DISTRIBUTION
The Ocean Cleanup measured the vertical distribution of plastic during six expeditions between 2013 to 2015. Results from these expeditions proved that the buoyant plastic mass is distributed within the top few meters of the ocean.,
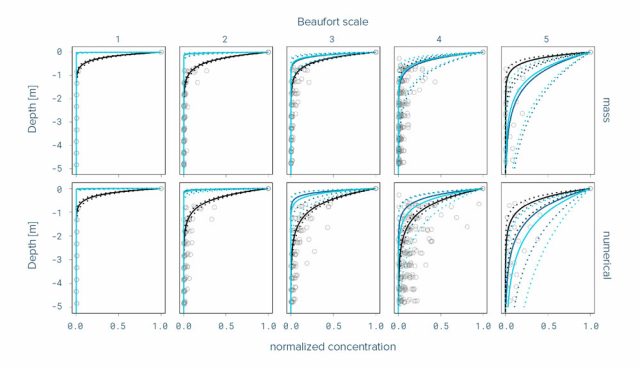
Factors such as wind speed, sea state, and plastic buoyancy will influence vertical mixing. However, buoyant plastic will eventually float back to the surface in calmer seas. Larger pieces were observed to resurface much more rapidly than smaller pieces.
PERSISTENCY
Characteristics of the debris in the Great Pacific Garbage Patch, such as plastic type and age, prove that plastic has the capacity to persist in this region.
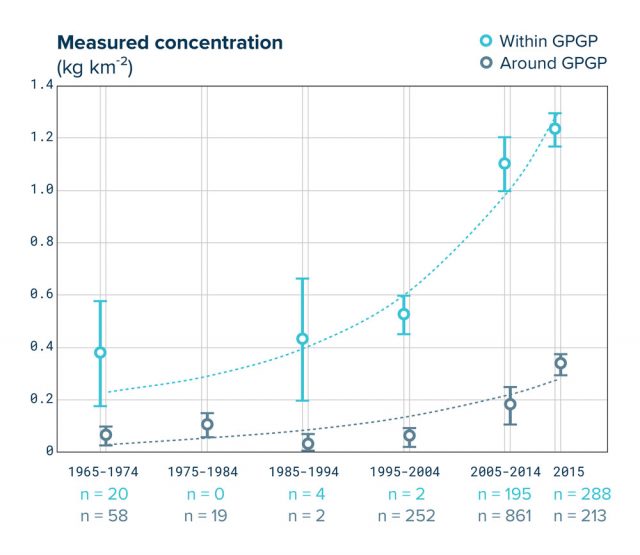
Plastic in the patch has also been measured since the 1970’s and the calculations from subsequent years show that microplastic mass concentration is increasing exponentially – proving that the input of plastic in the patch is greater than the output. Unless sources are mitigated, this number will continue to rise.
WHAT TYPES OF PLASTIC FLOAT
N THE GREAT PACIFIC GARBAGE
PATCH
The vast majority of plastics retrieved were made of rigid or hard polyethylene (PE) or polypropylene (PP), or derelict fishing gear (nets and ropes particularly). Ranging in size from small fragments to larger objects and meter-sized fishing nets.
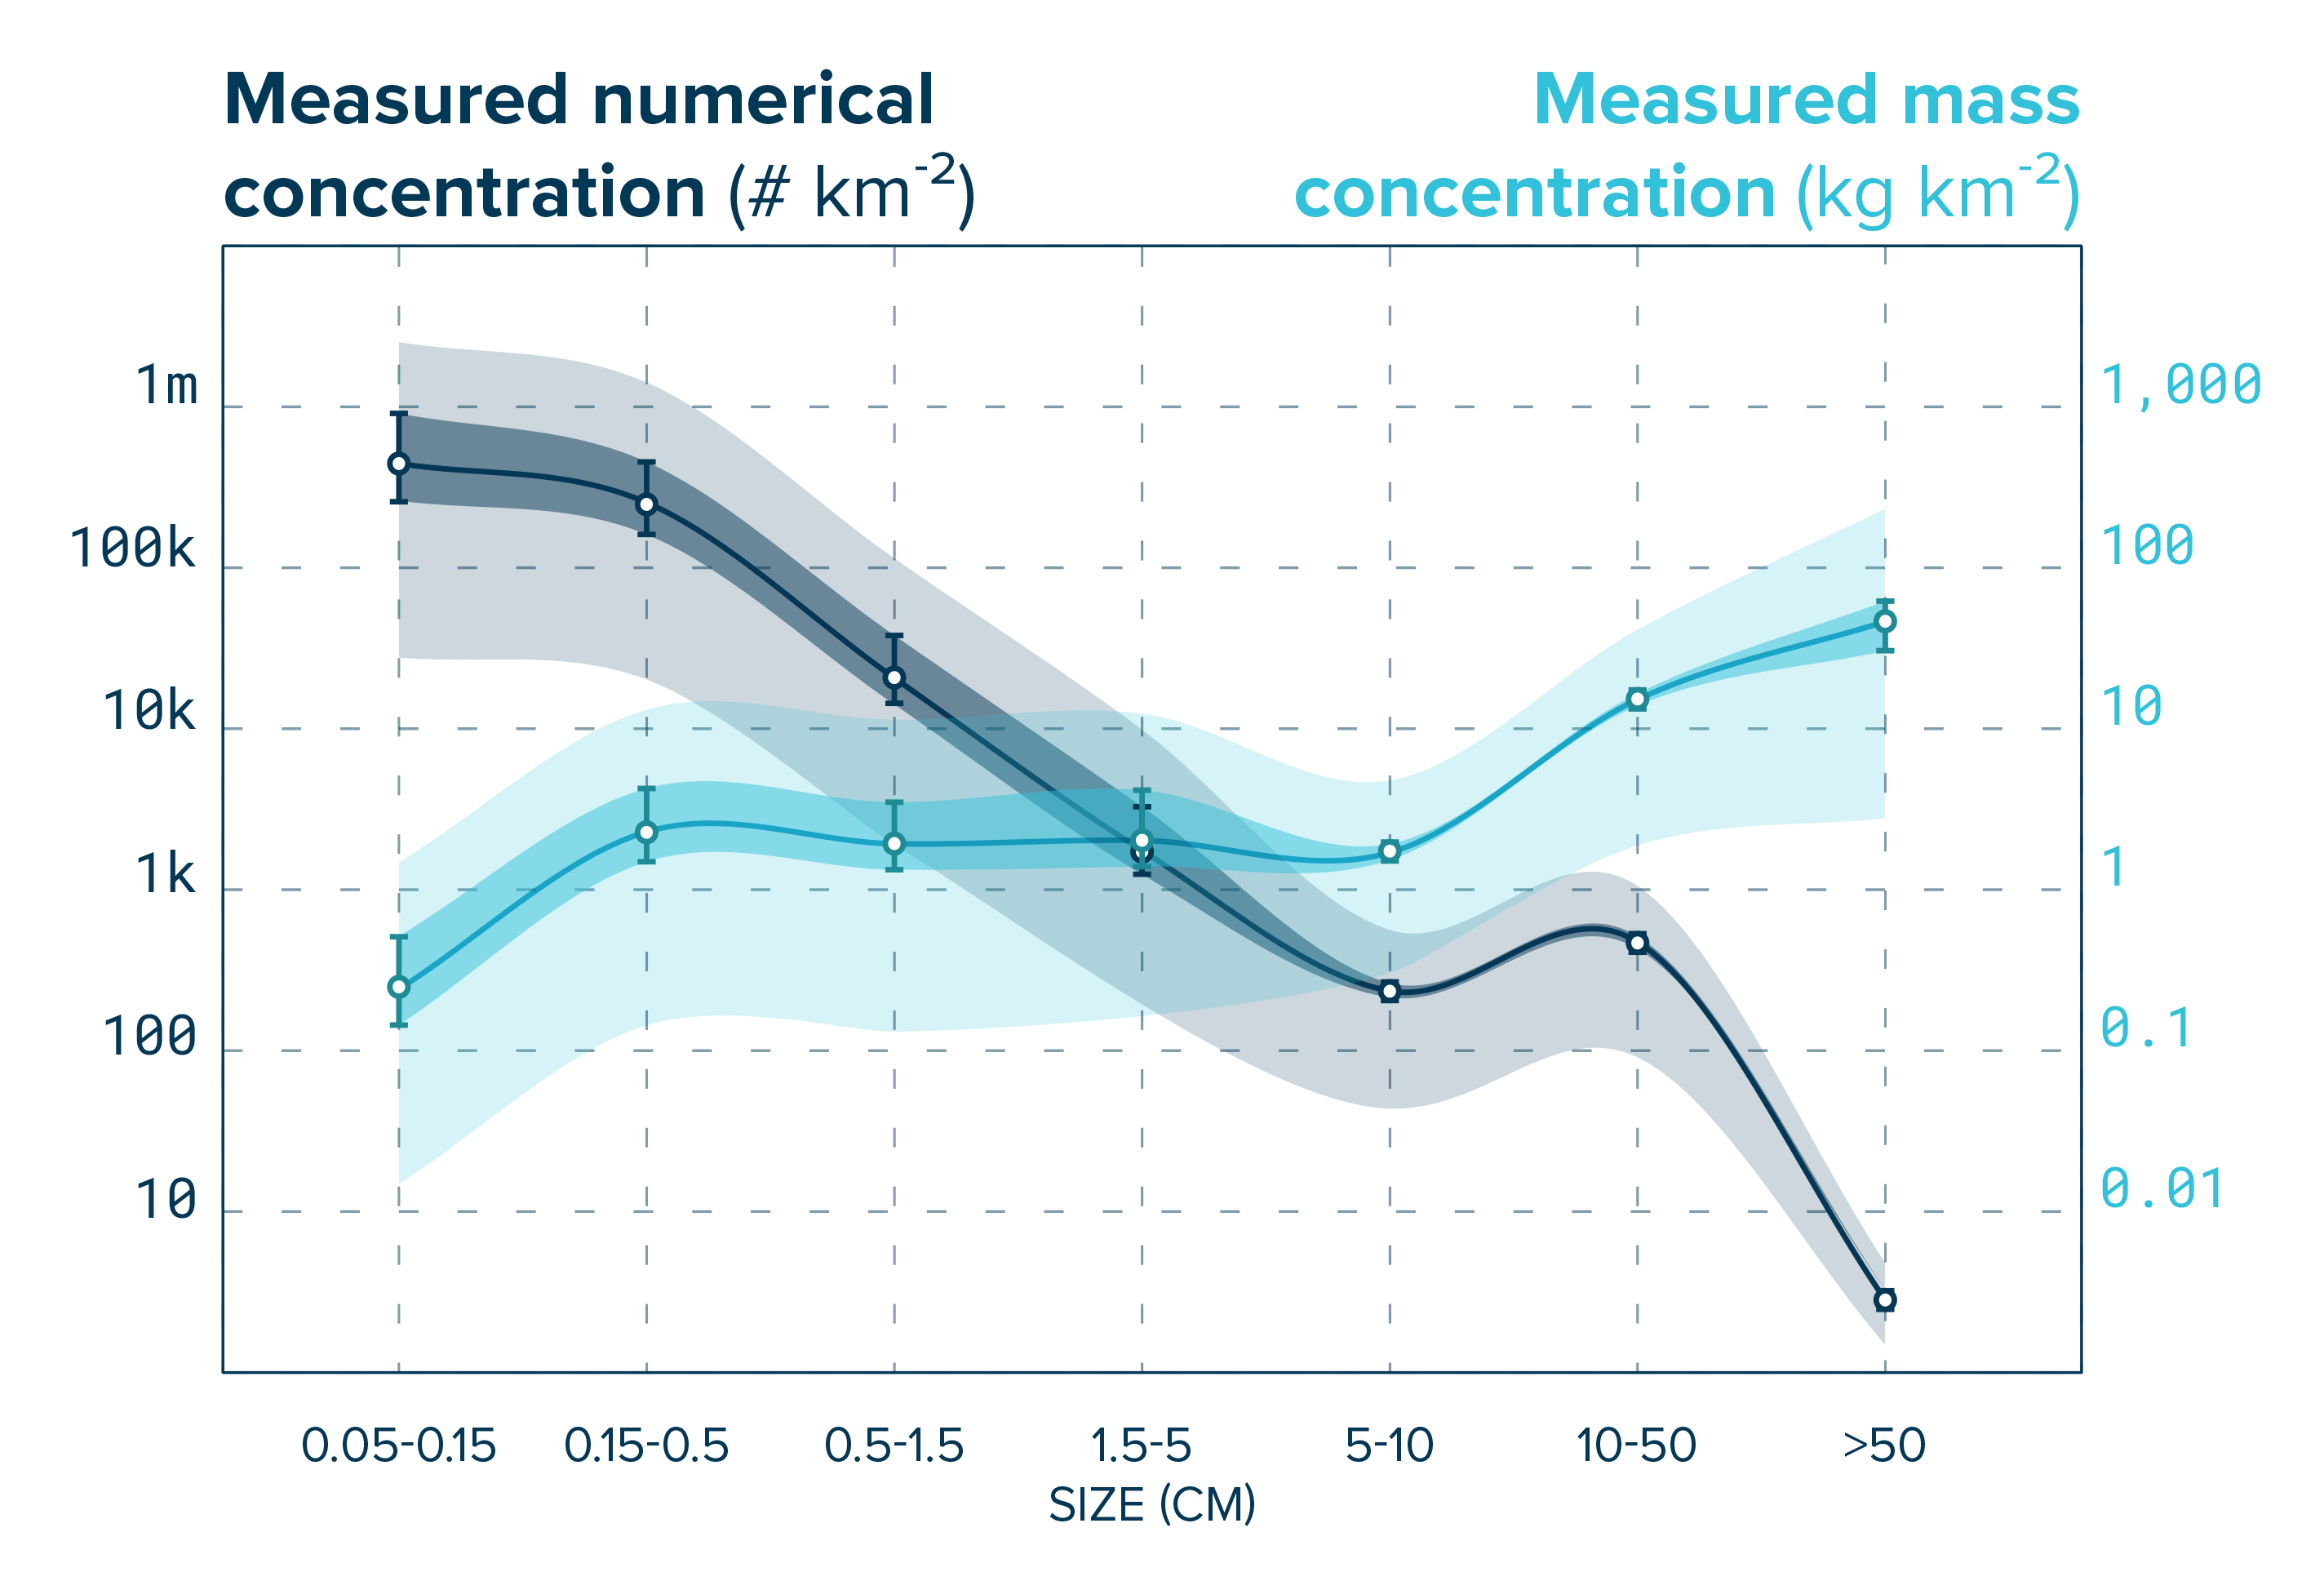
SIZE CLASSES
Plastic within the patch was categorized into four size classes:
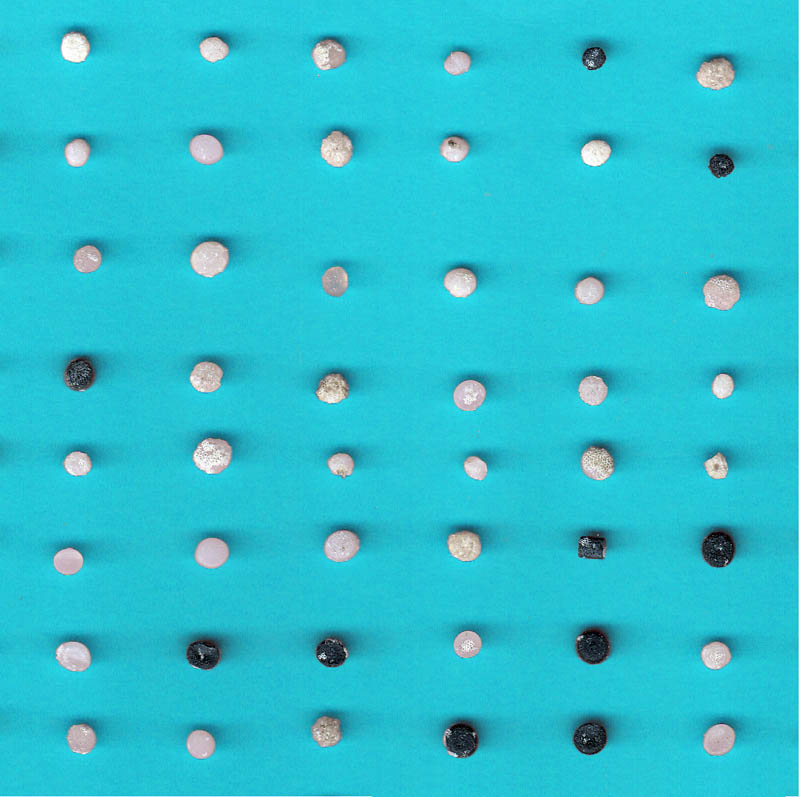
– Microplastics (0.05 – 0.5 cm)
– Mesoplastics (0.5 – 5 cm)
– Macroplastics (5 – 50 cm)
– Megaplastics (anything above 50 cm)
" 92% OF THE TOTAL
MASS IS MADE
OF DEBRIS LARGER
THAN 5MM "
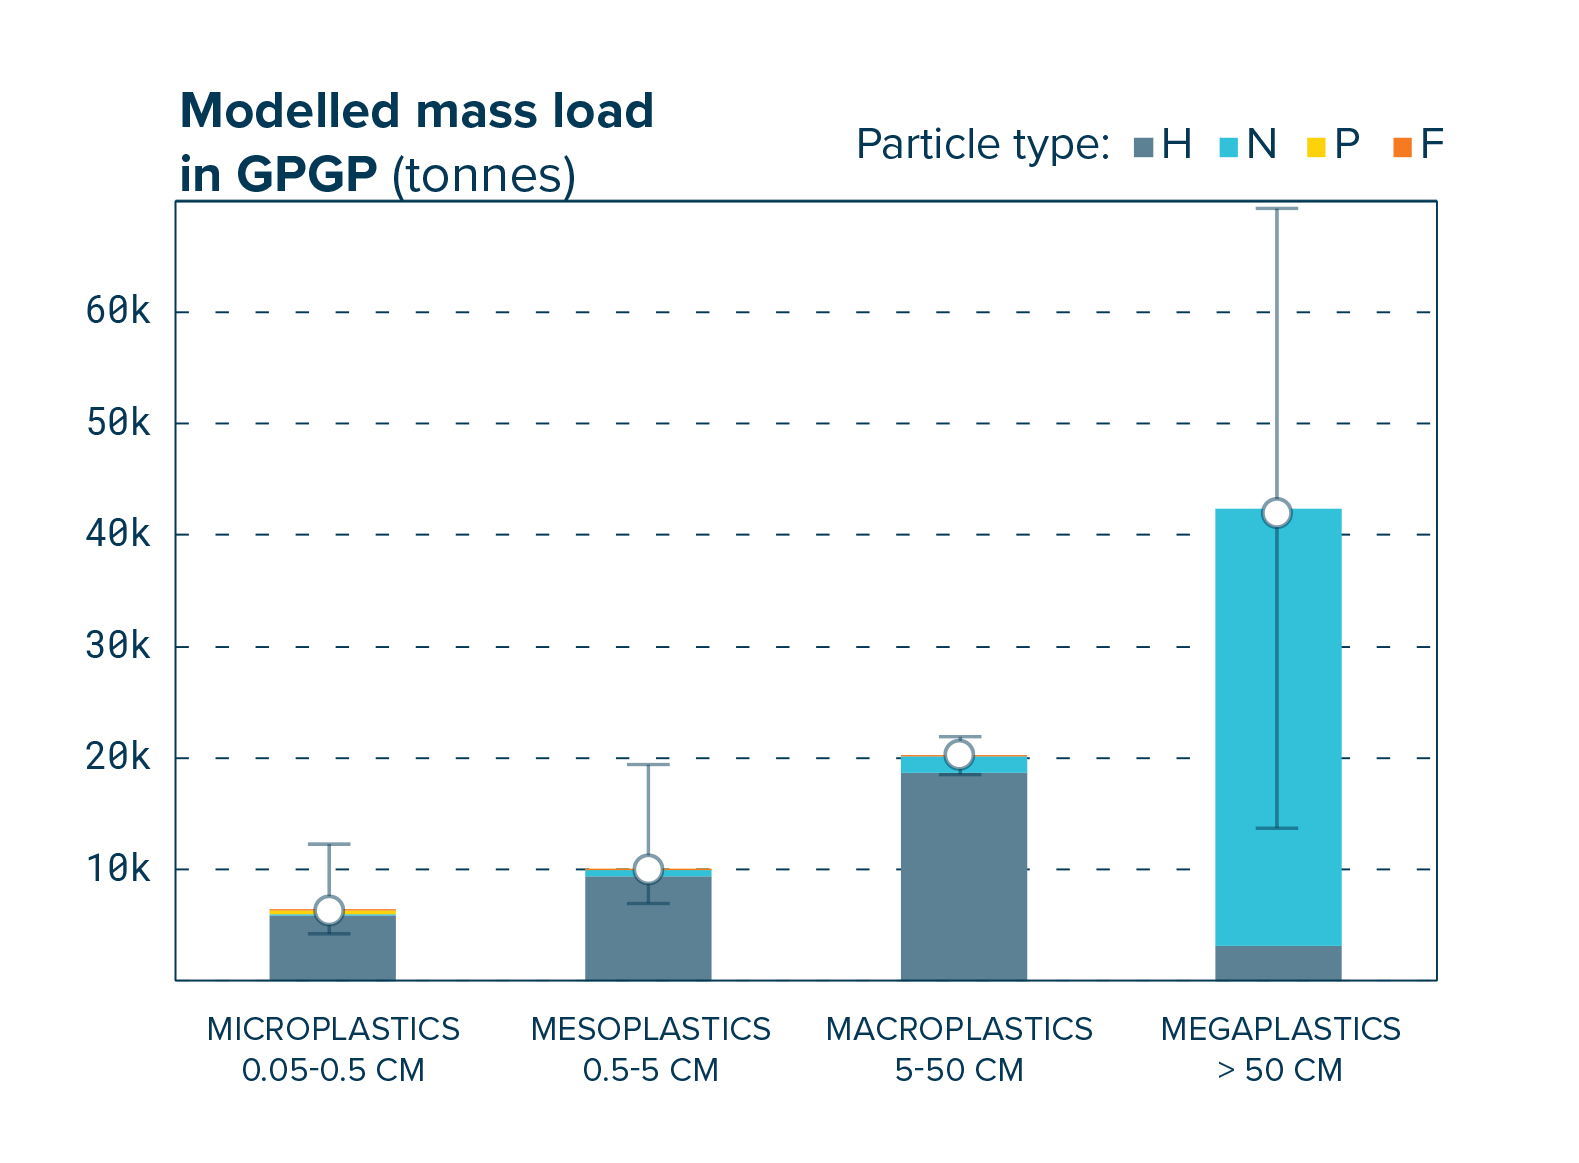
When accounting for the total mass, 92% of the debris found in the patch consists of objects larger than 0.5 cm, and three-quarters of the total mass is made of macro- and mega plastic. However, in terms of object count, 94% of the total is represented by microplastics.
CATEGORIZATION TYPES
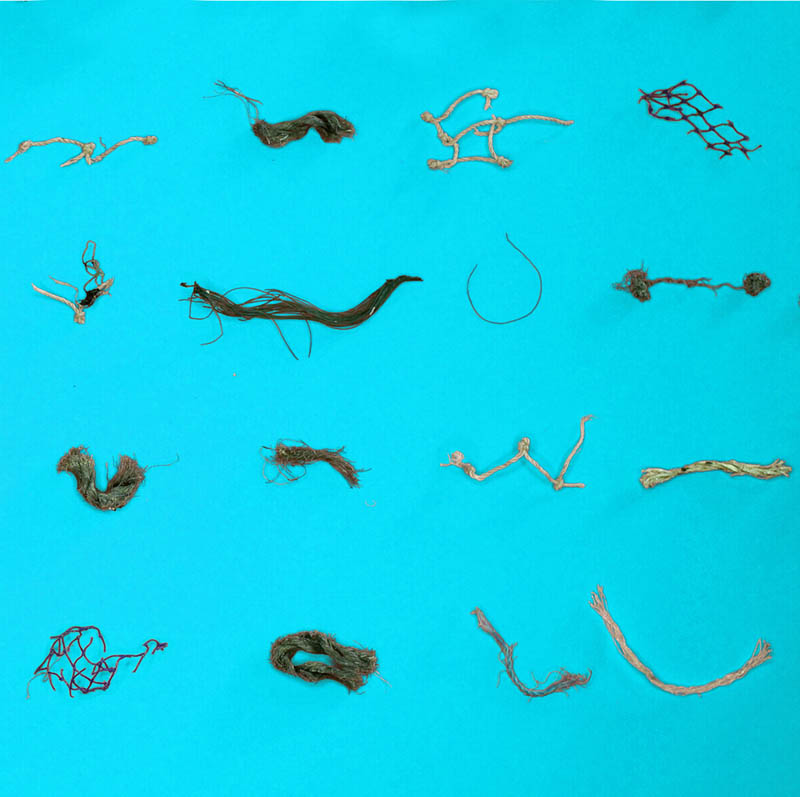
" 46% OF THE TOTAL
MASS IS MADE
OF FISHING NETS "
Once the plastics were collected, a team of volunteers classified the plastic into:
– Type H: Hard plastic, plastic sheet or film;
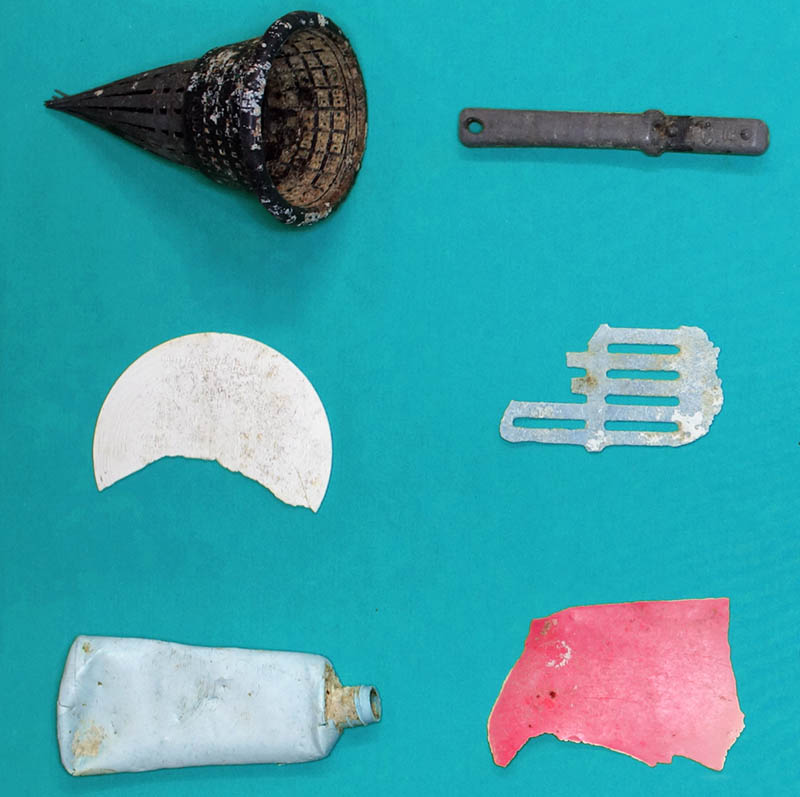
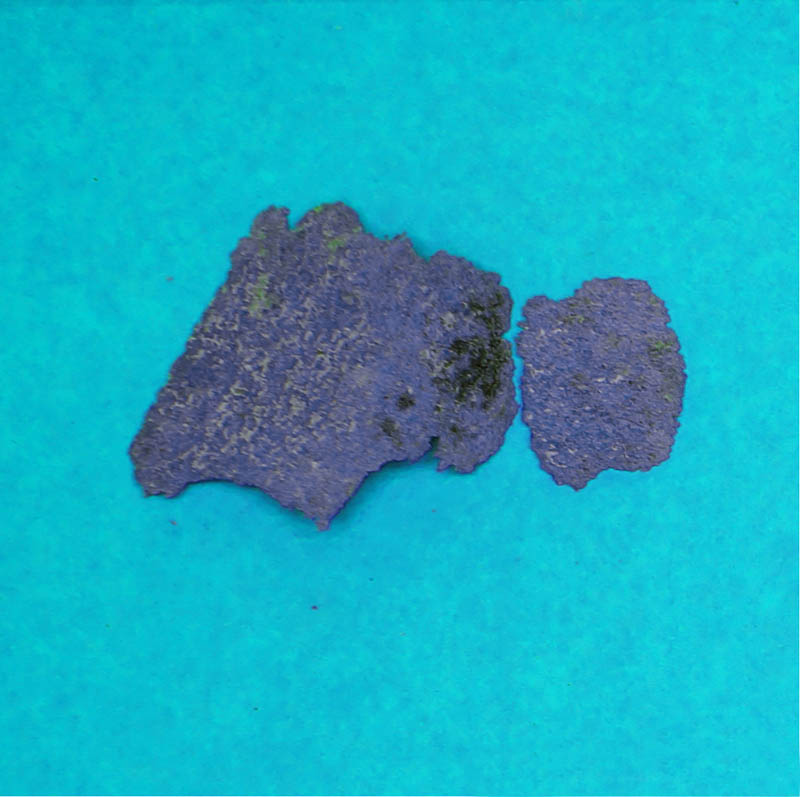
These plastic types were then screened for clues on age and origin. This was performed by examining each object for dates, languages, trademarks, symbols or ‘made in’ statements.
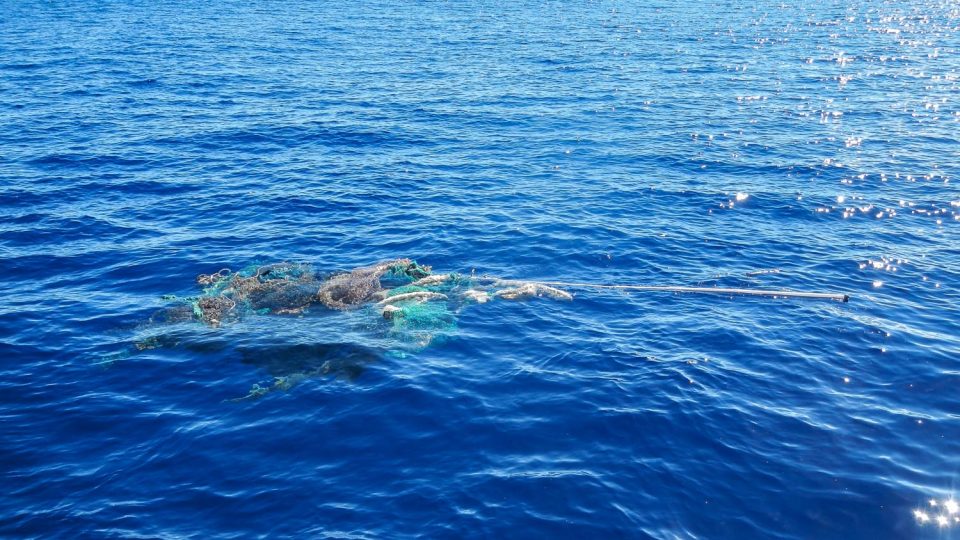
A ghostnet floating in the Great Pacific Garbage Patch.
Photo credits: The Ocean Cleanup
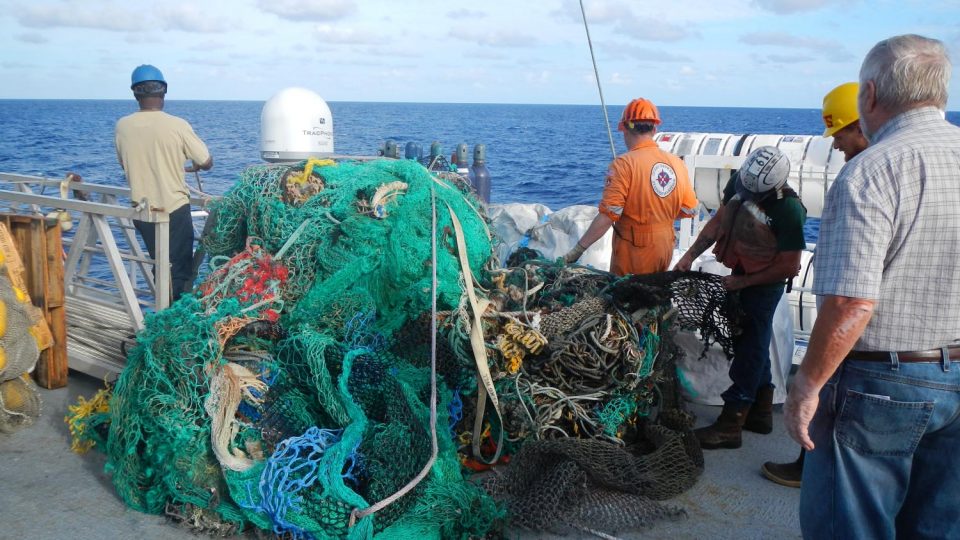
Ghostnet retrieved on the Mega Expedition mothership.
Photo credits: The Ocean Cleanup
Because the plastics have been shown to persist in this region, they will likely break down into smaller plastics while floating in the GPGP.
This deterioration into microplastics is usually the result of sun exposure, waves, marine life, and temperature changes. Microplastics have been discovered floating within the water surface layers, but also in the water column or as far down as the ocean floor.
Once they become this small, microplastics are very difficult to remove and are often mistaken for food by marine animals.
Once they become this small, microplastics are very difficult to remove and are often mistaken for food by marine animals.
WHAT ARE THE EFFECTS ON
MARINE LIFE AND HUMANS?
Not only does plastic pollution in the Great Pacific Garbage Patch pose risks for the safety and health of marine animals, but there are health and economic implications for humans as well.
IMPACT ON WILDLIFE
Plastic has increasingly become a ubiquitous substance in the ocean. Due to its size and color, animals confuse the plastic for food, causing malnutrition; it poses entanglement risks and threatens their overall behavior, health, and existence.
" 84% OF SAMPLES
CONTAINED TOXIC
CHEMICALS IN EXCESS "
Studies have shown that about 700 species have encountered marine debris, and 92% of these interactions are with plastic. 17% of the species affected by plastic are on the IUCN (International Union for Conservation of Nature) Red List of Threatened Species.
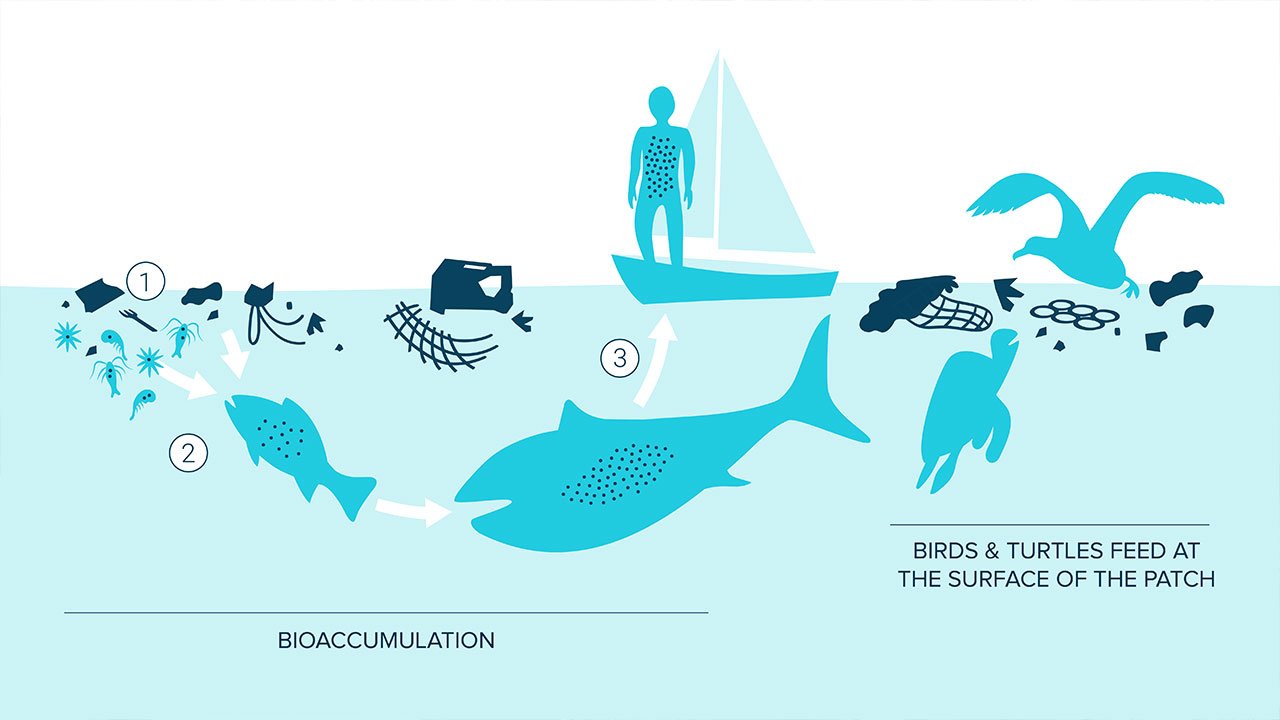
Toxic for Sea Surface Feeders
Toxic for Sea Surface Feeders
Floating at the surface of the Great Pacific Garbage Patch (GPGP) is 180x more plastic than marine life. Animals migrating through or inhabiting this area are then likely consuming plastic in the patch. For example, sea turtles by-caught in fisheries operating within and around the patch can have up to 74% (by dry weight) of their diets composed of ocean plastics. Laysan albatross chicks from Kure Atoll and Oahu Island have around 45% of their wet mass composed of plastics from surface waters of the GPGP.
Since 84% of this plastic was found to have at least one Persistent Bio-accumulative Toxic Persistent Bio-accumulative Toxic (PBT) chemical, animals consuming this debris are therefore ingesting the chemicals attached to the plastic.
THAN FOOD AT THE
SURFACE OF THE
GREAT PACIFIC
GARBAGE PATCH "
Entanglement of Marine Life
Fishing nets account for 46% of the mass in the GPGP and they can be dangerous for animals who swim or collide into them and cannot extract themselves from the net. Interaction with these discarded nets, also known as ghost nets , often results in the death of the marine life involved.
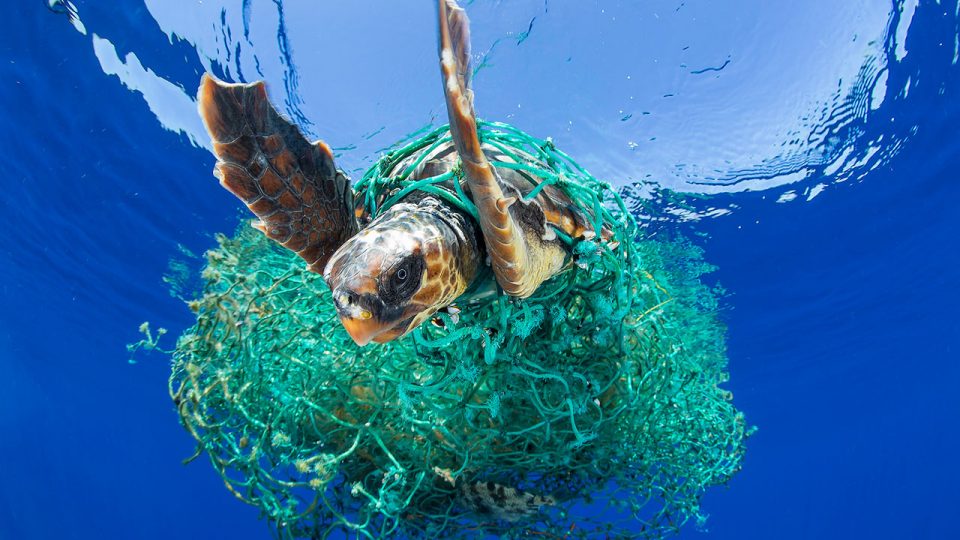
01 - A sea turtle entangled in a ghost net.
Photo credits: Francis Perez
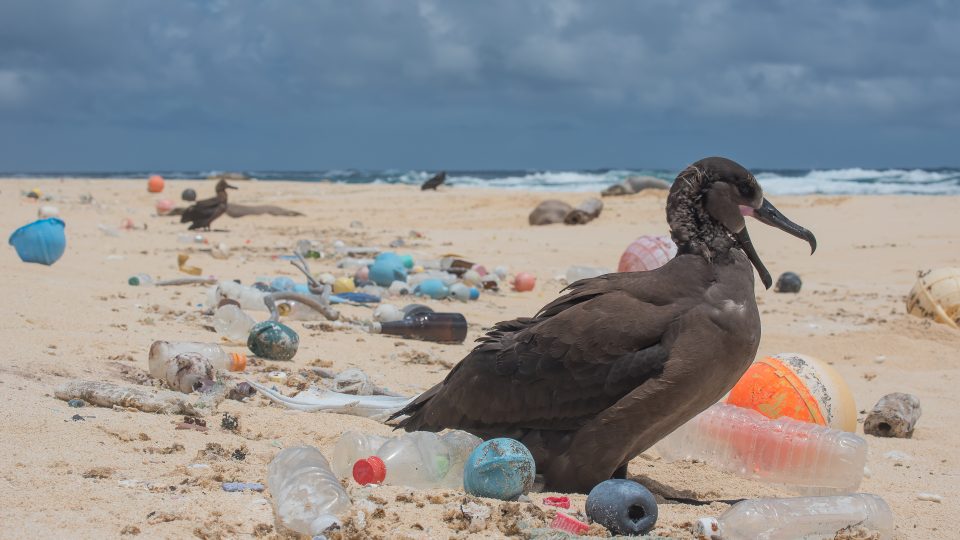
A bird surrounded by ocean plastic on the Northwestern Hawaiian Islands.
Photo credits: Matthew Chauvin
IMPACT ON HUMANS AND SOCIETY
Once plastic enters the marine food web, there is a possibility that it will contaminate the human food chain as well. Efforts to clean and eradicate ocean plastic have also caused significant financial burdens.
" PLASTIC POLLUTION
COSTS 13B DOLLARS
PER YEAR. "
Through a process called bioaccumulation, chemicals in plastics will enter the body of the animal feeding on the plastic, and as the feeder becomes prey, the chemicals will pass to the predator – making their way up the food web that includes humans. These chemicals that affected the plastic feeders could then be present within the human as well.
Affects the Economy
The United Nations reported that the approximate environmental damage caused by plastic to marine ecosystems represents 13 billion USD. This figure included the cost of beach cleanups and the financial loss incurred by fisheries.
- รับลิงก์
- X
- อีเมล
- แอปอื่นๆ


ความคิดเห็น
แสดงความคิดเห็น